04 August 2010

Java IO Faster Than NIO?

The following article on /. piqued my interest: Java IO Faster Than NIO

I read Paul Tyma's slides intently because the subject of "how do you design a massively scalable server?" is one of my favorite topics. There are so many interesting areas to explore in this area.

I have designed several scalable servers over the years. In one case this was for some telco-class equipment that I was helping to design. On that project I ended up using a combination of threads, /dev/poll (on platforms that had this) and poll() (on other platforms). I was under a large amount of pressure to make things fast/scalable on this project, so I was always tinkering around. In the end, I came up with a fairly high-performance communications subsystem that satisfied the goals that we had. The test harnesses that I wrote to go along with this server seemed to validate this as well.

For work on another scalable server that I designed, I went with Java NIO. This is why the article referenced on /. interested me so much. When I started on this particular project, I had no idea of whether to go with a blocking/threads-based architecture or a pure NIO-based system. In the end, I guessed that NIO might be faster so I went with that. The design that I came up with for this server is based on a lot of research that I've done over the years, and this server appears to be very scalable and fast.

I do have some other random thoughts on this topic...

  • One of the scalable servers that I have designed happens to interact with SSL/TLS. I have to tell you -- getting a non-blocking I/O layer to interact correctly and efficiently with a SSL/TLS layer is pretty complicated. I spent a huge amount of brainpower and time getting things right here. Given the information that is presented in Tyma's article, if I were to start designing a scalable Java-based server again, I would definitely consider just using Java IO rather than NIO. This would make the code much more simple and straightforward.
  • Speaking of making a high-performance communications subsystem, what's the deal with all of the postings on the web from "programmers" who can't figure out how to use their socket API so they insert calls to sleep() in order to "guarantee" that they can read/write data? I must have seen a dozen postings with advice like this. This boggles my mind! A call to sleep() has no place in a high-performance communications subsystem, and anybody who puts one there is not producing good quality code.
  • In Tyma's slides, I especially liked the story of Rob Van Behren. When I got to the sentence that read "[w]hen he was done, he sat back and realized he had written the foundation for a threading package" I felt like I had known this gentleman named Rob for a hundred years...

14 July 2010

Around The Big Lake


Bike route 576671 - powered by Bikemap

It was challenging and rewarding ride. Definitely the hottest and hilliest ride I've ever done.

I'm telling you right now, and I am deadly serious about this: there is nothing better than going on a challenging adventure with a great bunch of people.

Thanks go to JP for putting together such an awesome route. Thanks to R.+S. for the water and the great support. S.'s cookies were to die for and were just the right thing after that one particular hill. C. kept on talking about "frappes in Wolfboro" and the idea of this kept me pedaling enthusiastically. R. pulled the paceline into Middleton while I was hanging on the back, trying to transfer every water droplet from my nearly empty bottles into my dehydrated body. T. and I even sprinted at mile 143, but he beat me by a wheel...{sigh}.

This was a great ride!

22 June 2010

How is your software project trending?

How is your software project trending? Are you going to make your deadline with time to spare? Is your project going to spend all of its time in development, leaving not enough time for testing? Is your project bogged down?

Can you understand how things are trending in ten seconds or less? Can other people in your organization understand these trends as well?

Do you employ any metrics to track this trend?

...

At the point I am at in my career, in addition to doing technical things, I also manage projects. When I first started managing projects (several jobs ago) the thing that I really wanted was a way to understand, in ten-seconds or less, was how the project was trending. I am somebody who believes that some metrics are very useful, and this is a metric that I really wanted.

I knew that the information that I wanted to understand was ultimately stored in the bug-tracking system that I was using, but I simply could not find any pre-packaged solution that gave me what I wanted.

So, I hacked together my own solution.

My solution basically consists of a "cron" job that queries the bug-tracking system for its data. I run this cronjob every morning at 12:05am.

What I do is as follows: I organize projects by milestones, and I track bugs by the milestone that they need to be addressed by. How all of this works at a given jobsite varies from company to company. But the essential point is that all of the bugs are organized by clear milestones.

Then, every morning at 12:05am, my cronjob runs, querying the bug-tracking system for its information. Generally, I think that looking at the previous 45 days worth of data provides a reasonable view of how a project is going, so my scripts default to using a 45-day window.

And then....my scripts produce graphs...one per milestone that I am interested in. One of the first things I do every morning when I get into work is to look at these graphs. I also publish these graphs so that everybody in the organization can see and understand these. I am, after all, a big believer in transparency.

Having this system run automatically at night is a win for me, because it gives me more time to do actual technical things during the day. I simply do not have time to futz with graphs every day.

I'll show you some examples of these graphs, but before I do, I have to issue the following disclaimer: ALL OF THE DATA THAT WAS USED TO GENERATE THESE GRAPHS IS FAKE.

Seriously, the data is fake, OK? Trust me.

So, here is an example:
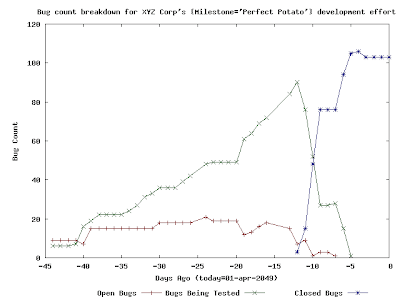
So, what we have here is a project in which ~100 bug tickets were written. Some of these tickets might have corresponded to feature requests and some of these tickets might have corresponded to actual bugs in the project itself. The graph here clearly tells how the work towards this milestone went overall: roughly 45 days before "01-apr-2049", work started in earnest. Work on the project started slowly, but then things picked up. If you consider the fact that the number of "Open Bugs" appears to be relatively constant over time and the number of "Bugs Being Tested" appears to be increasing greatly over time, then you can easily deduce two things:
  • during this time, the number of new bugs being written against this project/milestone was roughly equal to the number of bugs being "fixed" and sent to SQA for testing.
  • SQA was getting a little bit backed up with tickets that they needed to test and verify...but this doesn't seem to have been a big deal because SQA seems to have had the capability to test/verify/close a large number of tickets in a short amount of time.
By interpreting this graph, you can even see pretty clearly that the project came to a pretty deliberate end. This is good. Everybody who looks at this graph should easily be able to understand all of this. This is the whole point of the graph.

Here is an example of another graph:
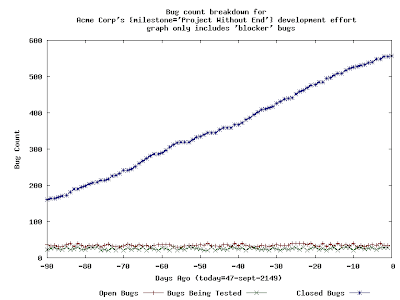
This is a much different graph than the previous graph. There are two things that I would like to immediately point out about this graph: this graph only includes tickets that have been deemed to be "blockers" to the release and also the window that this graph depicts has been increased to three months.

The addition of the "blockers" criteria is something that I have added to my reporting tools. My thinking is that, at some point in a software release, the whole organization needs to just concentrate on blockers and nothing else. Hence, my reporting tools offer this capability.

I have increased the reporting window here to ninety days to better illustrate the points that I will make next.

There is something very likely wrong with a development effort that produces the preceding graph. The number of open "blocker" bugs never trends towards zero, and neither does the number of "testing" bugs. It should be very easy to understand the following point: unless and until these two lines reach "zero", the organization cannot complete its software release. Even more troubling than this is the fact that the number of "closed" blockers is constantly increasing, which indicates that there is a constant stream of "blocker bugs" being found and fixed...for nearly three months.

How serious is all of this? Well, it depends on THE SCHEDULE, of course. In my experience, three months is a long time to be working on a single milestone, so, if I were to see a graph like this, I'd be pretty concerned.

...

These graphs are a (trivial) invention of mine, and I find them to be useful in my work in managing projects. I hope that others find this technique to be useful!

....

Update:  naturally, soon after I published this, I learned that this is type of graph has an official name:  burn down chart.  I continue to find these charts to be useful in my own planning and management.

17 June 2010

Dream for a Dollar

A friend of my wife's sent along the following email:
I'm sending this email to ask each of you to pass this website along to as many people as you know. As most of you know my son Travis has Muscular Dystrophy. He is in need of a new van that will get adaptive equipment from the State of Massachusetts. However the cost of the vehicle is the responsibility of the disabled driver and the state presents only two options of vehicles to choose from, a large industrial van or a Town and Country. These are the only two vehicles the State can adapt to hand controls and lower the floor. His current van is battered and bruised and in constant need of parts replacement. The State has slotted him for a new vehicle so the process has begun.

Dream for a Dollar is just that ... we are asking folks to donate a dollar. Not much. We're hoping his site will go viral and dollar donations will add up. So asking people you know to send this site out to as many people as they know will be a great help.

Please follow Travis' progress, his stories and updates on http://www.dreamforadollar.org

This seemed like a good cause to us, and we know that the need is legitimate.

If you are reading this, perhaps you'd like to donate too?

07 May 2010

Mt. Delight is delightful.

It was a nice ride, but no KOM points for me...I'm just glad that I felt strong the whole way.


Bike route 465206 - powered by Bikemap 


Thanks for the great ride T.!

06 May 2010

More fun with network graphs

The work that I have done with analyzing a particular kind of network traffic has continued to bear fruit. For reference, please see my earlier posting "Updated graph from silly network attack".

A couple of weeks ago I was dealing with a different ${organization} than I was describing in my previous posts. They have a totally different network setup at this new site, and, I would soon learn, a totally different scale of traffic.

Here is a graph generated from the data that I collected at this site (same protocol as before):
If you compare this graph to the previous ${organization}'s graph, it is easy to see that this new ${organization} has a completely different scale of traffic. In fact, my data-collection scripts collected so much information in 24 hours at this site that it took some of my post-processing scripts over 20 hours to wade through all of the data!

The thing about this graph is that (unfortunately) there is no obvious spike in traffic that we can focus on to find a problem on the network. The graph does show one thing pretty clearly though: there is a LOT of this type of traffic on this network (especially during daytime hours).

The thing is, it is my position that there is TOO MUCH of this type of traffic on this network. So, in an effort to try to justify my position, I decided to look more deeply into the data. Luckily, this was pretty easy to do, since my post-processing tools also generate a sorted list of how much of this traffic each node on the network generates. With this information, I was able to quickly find some nodes on the network that were responsible for a huge amount of this traffic.

In fact, after looking at the data for a while, I learned that the node on the network that generated the most traffic (by far) was transmitting this traffic using the following pattern:

top_of_loop:

do this 8 times
send this ${Protocol} ${Verb}
wait 10ms
done

sleep 6 seconds

goto top_of_loop;

The thing is, if you know anything about this ${Protocol}, it is unreasonable for a single node on the network to be transmitting more than one of these ${Verbs} onto the network every, oh.... 10 seconds (and, if everything works out, the node should STOP transmitting this traffic at this point...). It could be argued that 20 seconds might be an even more reasonable value in this situation. At transmission rates higher than this, this node is basically causing a denial-of-service attack, no matter what its intentions are. This is simply an unreasonable amount of traffic for one node to generate.

It turns out that there is a straightforward way to rate-limit all of this traffic on this network. I don't control this ${organization}'s network, but I thought that before I recommended this configuration to this ${organization} that I'd try to model what it would look like if this rate-limit were put into effect.

The thing is, it turns out that we can model this configuration easily enough. All I had to do to model this configuration change was to modify my post-processing scripts to simulate the rate-limit that I was proposing. Then I just took this modified post-processing script and sent all of the original data that I collected at this site through this. This gives us a very good idea of what effect a per-node 10 second rate limit would have on this network's ${Protocol} traffic.

Here is a graph that shows the overall effect of a 10 second rate-limit:

Here is a graph that shows the overall effect of a 20 second rate limit:


Again, putting some sort of rate-limit rule into effect on this network shouldn't be controversial -- really, there is no reason for any node on the network to be hammering the network with this type of traffic. Discussions are ongoing with ${organization} as to the details of this rate-limit rule.

I'm just happy that I could analyze this data, point out some obvious problems, suggest a solution, and provide a way of simulating the results of my suggestion. I am optimistic that my rate-limiting scheme will go a long way towards making this ${organization}'s network a lot more usable and responsive.

26 April 2010

Text Editor Fu

I enjoyed reading "Staying the hell out of insert mode". I have to concur with the author of this article: insert mode is not the most powerful mode in vi.

I don't claim to be some sort of text editing guru or anything. In my career I've met some people who can do some awesome things with their text editor. I always like learning new tricks and techniques.

Getting back to the article that I mentioned above, for me, the reason why insert mode in vi isn't the most powerful mode in vi is because in command mode you can do things like
'c,.!perl -pe 's/foo/bar/'
...and, if you know anything at all about me, you know that I have a thing for Perl one-liners...

I'm not really a heavy-duty vi user though. I'm more of an XEmacs user. In Emacs/XEmacs, you'd type something more like:
C-u M-| perl -pe 's/foo/bar/'
The one person who reads this blog might be wondering "why not use the natural capabilities of the text editor itself to do transformations like this?". To this I pretty much have to shrug and respond "this works for me". It is probably safe to say that a huge percentage of the code I have ever produced in my life has been produced through keystrokes that start with "C-u M-|".

Basically, I am lazy and I would rather let the computer do the typing for me...